
Monday Market Review: June 8, 2026
- Investment Committee

- Jun 9
- 7 min read
Weekly Summary
Economic data included improvement in manufacturing and services ISM indexes, in addition to strong gains in the May employment situation report, led perhaps some temporary factors.
Equities fell back for the first time in weeks as technology-related sentiment paused. Bonds also lost ground as interest rates rose. Commodities were mixed with gains in energy being offset by weakness elsewhere.
What to know about the markets:
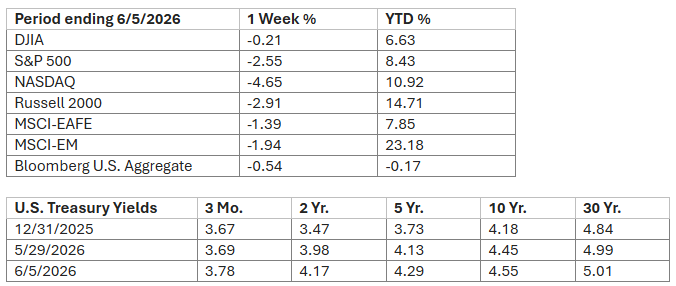
U.S. stocks started the week positively, but ended negatively for the first time in weeks, as markets were less enthused about the overly-strong jobs report, as it confirmed the low likelihood of Federal Reserve cuts anytime soon, at least based on weak labor conditions. Then again, after a strong stock market run as of late, it often doesn’t take much to generate a reason to take a bit of a breather. By sector, gains were led by energy and health care, up over 2% each, while recent leaders technology (Microsoft and Intel), consumer discretionary (Amazon and Tesla), and communications all fell back by -4% to -6%. Semiconductors pulled back especially late in the week, in contrast to their exceptional upward run since the end of March. Real estate also saw gains of over a percent.
Foreign stocks fell back in similar fashion to U.S. markets last week, with developed markets outperforming emerging. International markets reacted to track Middle East developments, an estimated outright shrinkage of the Eurozone economy by a few tenths of a percent in Q1, and also the new U.S. administration’s new proposed tariff against imports ‘produced with forced labor,’ which would effectively raise the tariff level by about a half-percent to just above 11%. In the latter, a sell-off in technology-related names especially punished recent favorites South Korea and Taiwan. The South Korean index has become increasingly concentrated towards Samsung and SK Hynix, which together represent nearly 50% of the country’s market cap, being pushed upward by semiconductor demand in recent months.
Bonds fell back again as interest rates ticked up along the yield curve, not helped by the strong employment report. Governments outperformed corporates slightly, except for floating rate bank loans, which were little-changed for the week. International bonds on the unhedged side were pulled down by a stronger dollar as well.
Commodities were mixed, with slight gains in energy offset by sharp declines in precious metals (higher interest rates) and agriculture (wheat, corn, and soybeans, due to signs of favorable U.S. growing conditions and higher supply). Crude oil rose another 3% last week to just over $90/barrel, as Middle East tensions remained high.
Our Weekly Economic Notes:
Notes key: (+) positive/encouraging development, (0) neutral/inconclusive/no net effect, (-) negative/discouraging development.
(+) The ISM manufacturing index rose by 1.3 points to 54.0 for May, beyond the 53.0 level expected, and further into expansion, running at the fastest pace in four years. The underlying components were strong as well, with gains in new orders and production further into expansion, while employment rose a few points, but stayed just below neutral at 49. Prices paid fell by over -2 points to 82, remaining elevated, while inventories rose a point to just under 50. Unsurprisingly, the Middle East conflict was mentioned by over 40% of respondents, and tariffs by just under 20%, like the prior month. Commentary noted that “prices continue to rise for many products,” particularly in electronic components related to data centers, and others related to the Iran war and “reductions in availability of oil/petroleum.” Importantly, it was noted that "business appears to be weakening,” due to uncertainty around the war’s duration, creating an unwillingness for capex in the longer-term (other than AI-related capex obviously, which continues to rise unabated).
(+) The ISM services/non-manufacturing index rose by 0.9 of a point to 54.5 for May, a bit above the 53.8 level expected, and moving slightly further into expansion. Underlying segments were decent, with new orders up 4 points to 57 and business activity up 2 points to 58—both strongly expansionary. However, employment fell by a tenth of a point to just under 48, remaining in contraction. Supplier deliveries fell by -2 points, implying slow deliveries for a smaller number of firms, while prices paid rose a half-point to 71, the highest level in nearly four years. Commentary from respondents mentioned the strength in new orders but attributed much of it to “seasonality,” as well as mentions of “hiring freezes” and “not backfilling” empty positions.
(+) Construction spending rose 0.4% in April, twice that of the prior month and the 0.2% expected by consensus, although the prior two months were each revised down considerably. For April, rises of 0.7-0.8% in private residential and public residential outshined a 0.4% rise in public non-residential and small decline in private non-residential. As construction costs rose by 0.3% in the month, real spending only rose by about a tenth of a percent.
(+) The government JOLTS job openings survey rose 731k in April to 7.618 mil., above the 6.866 mil. expected. This was led by a substantial gain in professional/business services (668k, the largest ever), as well as health care/social assistance (89k), offsetting drops in finance/insurance (-135k) and accommodation/food services (-74k). The job openings rate rose by 0.4% to 4.6% while the hiring rate fell by -0.3% to 3.2%. On the departure side, the layoff and quits rates each fell by -0.1% to 1.1% and 1.9%, respectively. On that overall metric, labor conditions continue to look decent.
(0) Initial jobless claims for the May 30 ending week rose by 13k to 225k, a bit above the 215k expected. Continuing claims for the May 23 week fell by -8k to 1.777 mil., below the 1.780 mil. expected by consensus. Claims were little-changed by state, which continue to point to minimal layoff activity across most industries. On the other hand, Challenger, Gray & Christmas noted that layoffs from U.S. employers have risen for three straight months, with ‘AI’ as the leading reason. However, it’s possible that diversions of spending towards AI purposes, expectations of future AI capabilities, as well as ‘AI-washing’ (i.e., using AI as a convenient excuse for layoffs conducted for other reasons) remain more plausible than AI replacement of jobs outright in most industries at present.
(+) The May employment situation report surprised on the upside, which appeared to lower the chances of the Federal Reserve cutting rates due to a weakening labor market. Ironically, this was good economic news that wasn’t celebrated in stock markets. Nonfarm payrolls rose by 172k, well above the 88k expected, and included strong upward revisions for both March (+29k to 214k) and April (+64k to 179k). Per the BLS, job gains occurred in leisure/hospitality (70k), local government (55k), health care (35k), durable goods manufacturing (17k, mostly in metals and transportation equipment), and construction (17k). However, employment fell in financial activities (-22k), non-durable goods manufacturing (-10k, most of which was in plastics, which could have been affected by recent supply concerns), and private education (-7k). The leisure/hospitality gain was most likely tied to U.S. World Cup preparations, and perhaps Memorial Day adjustments, so may need to be discounted for a bit. The unemployment rate was unchanged at 4.3%, while the U-6 underemployment rate fell by a tenth to 8.1%, largely due to a decline in part-time workers for economic reasons. Average hourly earnings rose by 0.3%, on par with expectations, and up 3.4% over the past 12 months. The average workweek length was unchanged at 34.3 hours.
Earlier in the week, the BLS released the Quarterly Census of Employment and Wages data used in benchmarking through Dec. 2025, and revised payroll data upward by 180k, or roughly 20k jobs per month from Apr. to Dec. The pattern of large revisions in payroll data seen over the past year are assumed to have been a direct reflection of substantial shifts in immigration, where inclusion/exclusion of a large number of undocumented workers have resulted in larger-than-expected adjustments in labor force size and calculation criteria.
(-) The final release for U.S. nonfarm productivity in Q1 was revised down by -0.5% to 0.3% on an annualized basis, also below the 1.6% pace of the prior Q4 quarter. The year-over-year rate was also taken down by a tenth to 2.8%. For better cyclical context, the quarters since pre-pandemic (starting Q4-2019) have seen productivity grow at an annualized rate of 2.1%. Unit labor costs were revised down substantially by -0.5% to 1.8% for Q1 on an annualized basis, as well as from 1.2% to 0.5% for the year-over-year period.
Have a good week.
Have investment questions? We're here to help. Schedule a call a complimentary Basics of Investing Zoom Session here.
Centered Financial, LLC is a registered investment adviser offering advisory services in the State of California, Utah, Texas and in other jurisdictions where exempted. The opinions voiced in this material are for general information only and are not intended to provide specific advice or recommendations for any individual. There is no assurance that the techniques, strategies, or investments discussed are suitable for all investors or will yield positive outcomes. To determine which strategies or investment(s) may be appropriate for you, consult your financial adviser prior to investing. Any discussion of strategies related to tax or legal planning is general and is not intended as tax or legal advice. Please consult appropriate tax and legal professionals for recommendations pertaining to your specific situation.
Sources: Ryan M. Long, CFA; Director of Investments; Palouse Capital Management
Palouse Capital Management, American Association for Individual Investors (AAII), Associated Press, Barclays Capital, Bloomberg, Citigroup, Deutsche Bank, FactSet, Financial Times, First Trust, Goldman Sachs, Invesco, JPMorgan Asset Management, Marketfield Asset Management, Morgan Stanley, MSCI, Morningstar, Northern Trust, PIMCO, Standard & Poor’s, StockCharts.com, The Conference Board, Thomson Reuters, T. Rowe Price, Univ. of Michigan, U.S. Bureau of Economic Analysis, U.S. Federal Reserve, Wall Street Journal, The Washington Post. Index performance is shown as total return, which includes dividends. Performance for the MSCI-EAFE and MSCI-EM indexes is quoted in U.S. Dollar investor terms.
The information above has been obtained from sources considered reliable, but no representation is made as to its completeness, accuracy or timeliness. All information and opinions expressed are subject to change without notice. Information provided in this report is not intended to be, and should not be construed as, investment, legal or tax advice; and does not constitute an offer, or a solicitation of any offer, to buy or sell any security, investment or other product. Advisory Solutions Group is a registered investment advisor.


Comments